
State Migration Trends: Taxes & State Population: IRS Data
Americans Are Moving to States with Lower Taxes and Sound Tax Structures

The extent to which state tax policies influence where people choose to live, work, and build their futures has been a matter of national debate for many years. The newly released IRS migration data for 2022–2023—which show moves that occurred between when taxpayers filed their tax year 2021 returns in calendar year 2022 and when they filed their tax year 2022 returns in 2023—provides valuable clarity on this important question. While job opportunities, housing affordability, climate, and family connections remain significant drivers of mobility, tax burdens and the broader fiscal environment continue to play a substantial role in shaping decisions.
This analysis of the latest state-level migration data reveals a continued and pronounced domestic shift: millions of Americans, along with significant amounts of income and economic activity, are moving from high-tax states to those with more competitive tax systems and lower overall costs of living. Tax differentials may not be the primary reason for an interstate move, but they are often one of several factors people consider when deciding whether—and where—to move.
Winners and Losers of Interstate Migration: States
The IRS data show that between 2022 and 2023, 27 states experienced a net gain in income tax filers from interstate migration, led by Texas (+56,473), Florida (+55,349), North Carolina (+39,118), South Carolina (+29,214), Tennessee (+24,104), Arizona (+17,316), Georgia (+14,671), and Colorado (+11,341). At the other end of the spectrum, California (-100,397), New York (-71,987), Illinois (-28,609), New Jersey (-19,370), Massachusetts (-15,378), Maryland (-13,628), and Pennsylvania (-12,095) lost the largest numbers of income tax filers.
Indiana and Vermont saw a loss in tax returns attributable to interstate migration but a gain in individuals associated with the returns of those who moved in (implying that bigger families moved in, while smaller families moved out). Virginia, DC, and Washington, in contrast, saw a gain in tax returns but a loss in the total number of individuals on those returns. States with the highest net adjusted gross income (AGI) gains included Florida at $20.6 billion, Texas at $5.5 billion, and several states (South Carolina, North Carolina, Arizona, and Tennessee) between around $2.75 billion and $4 billion each. States with the highest net AGI losses included California at -$11.9 billion, New York at -$9.9 billion, Illinois at -$6 billion, Massachusetts at -$3.9 billion, and New Jersey at -$2.55 billion.
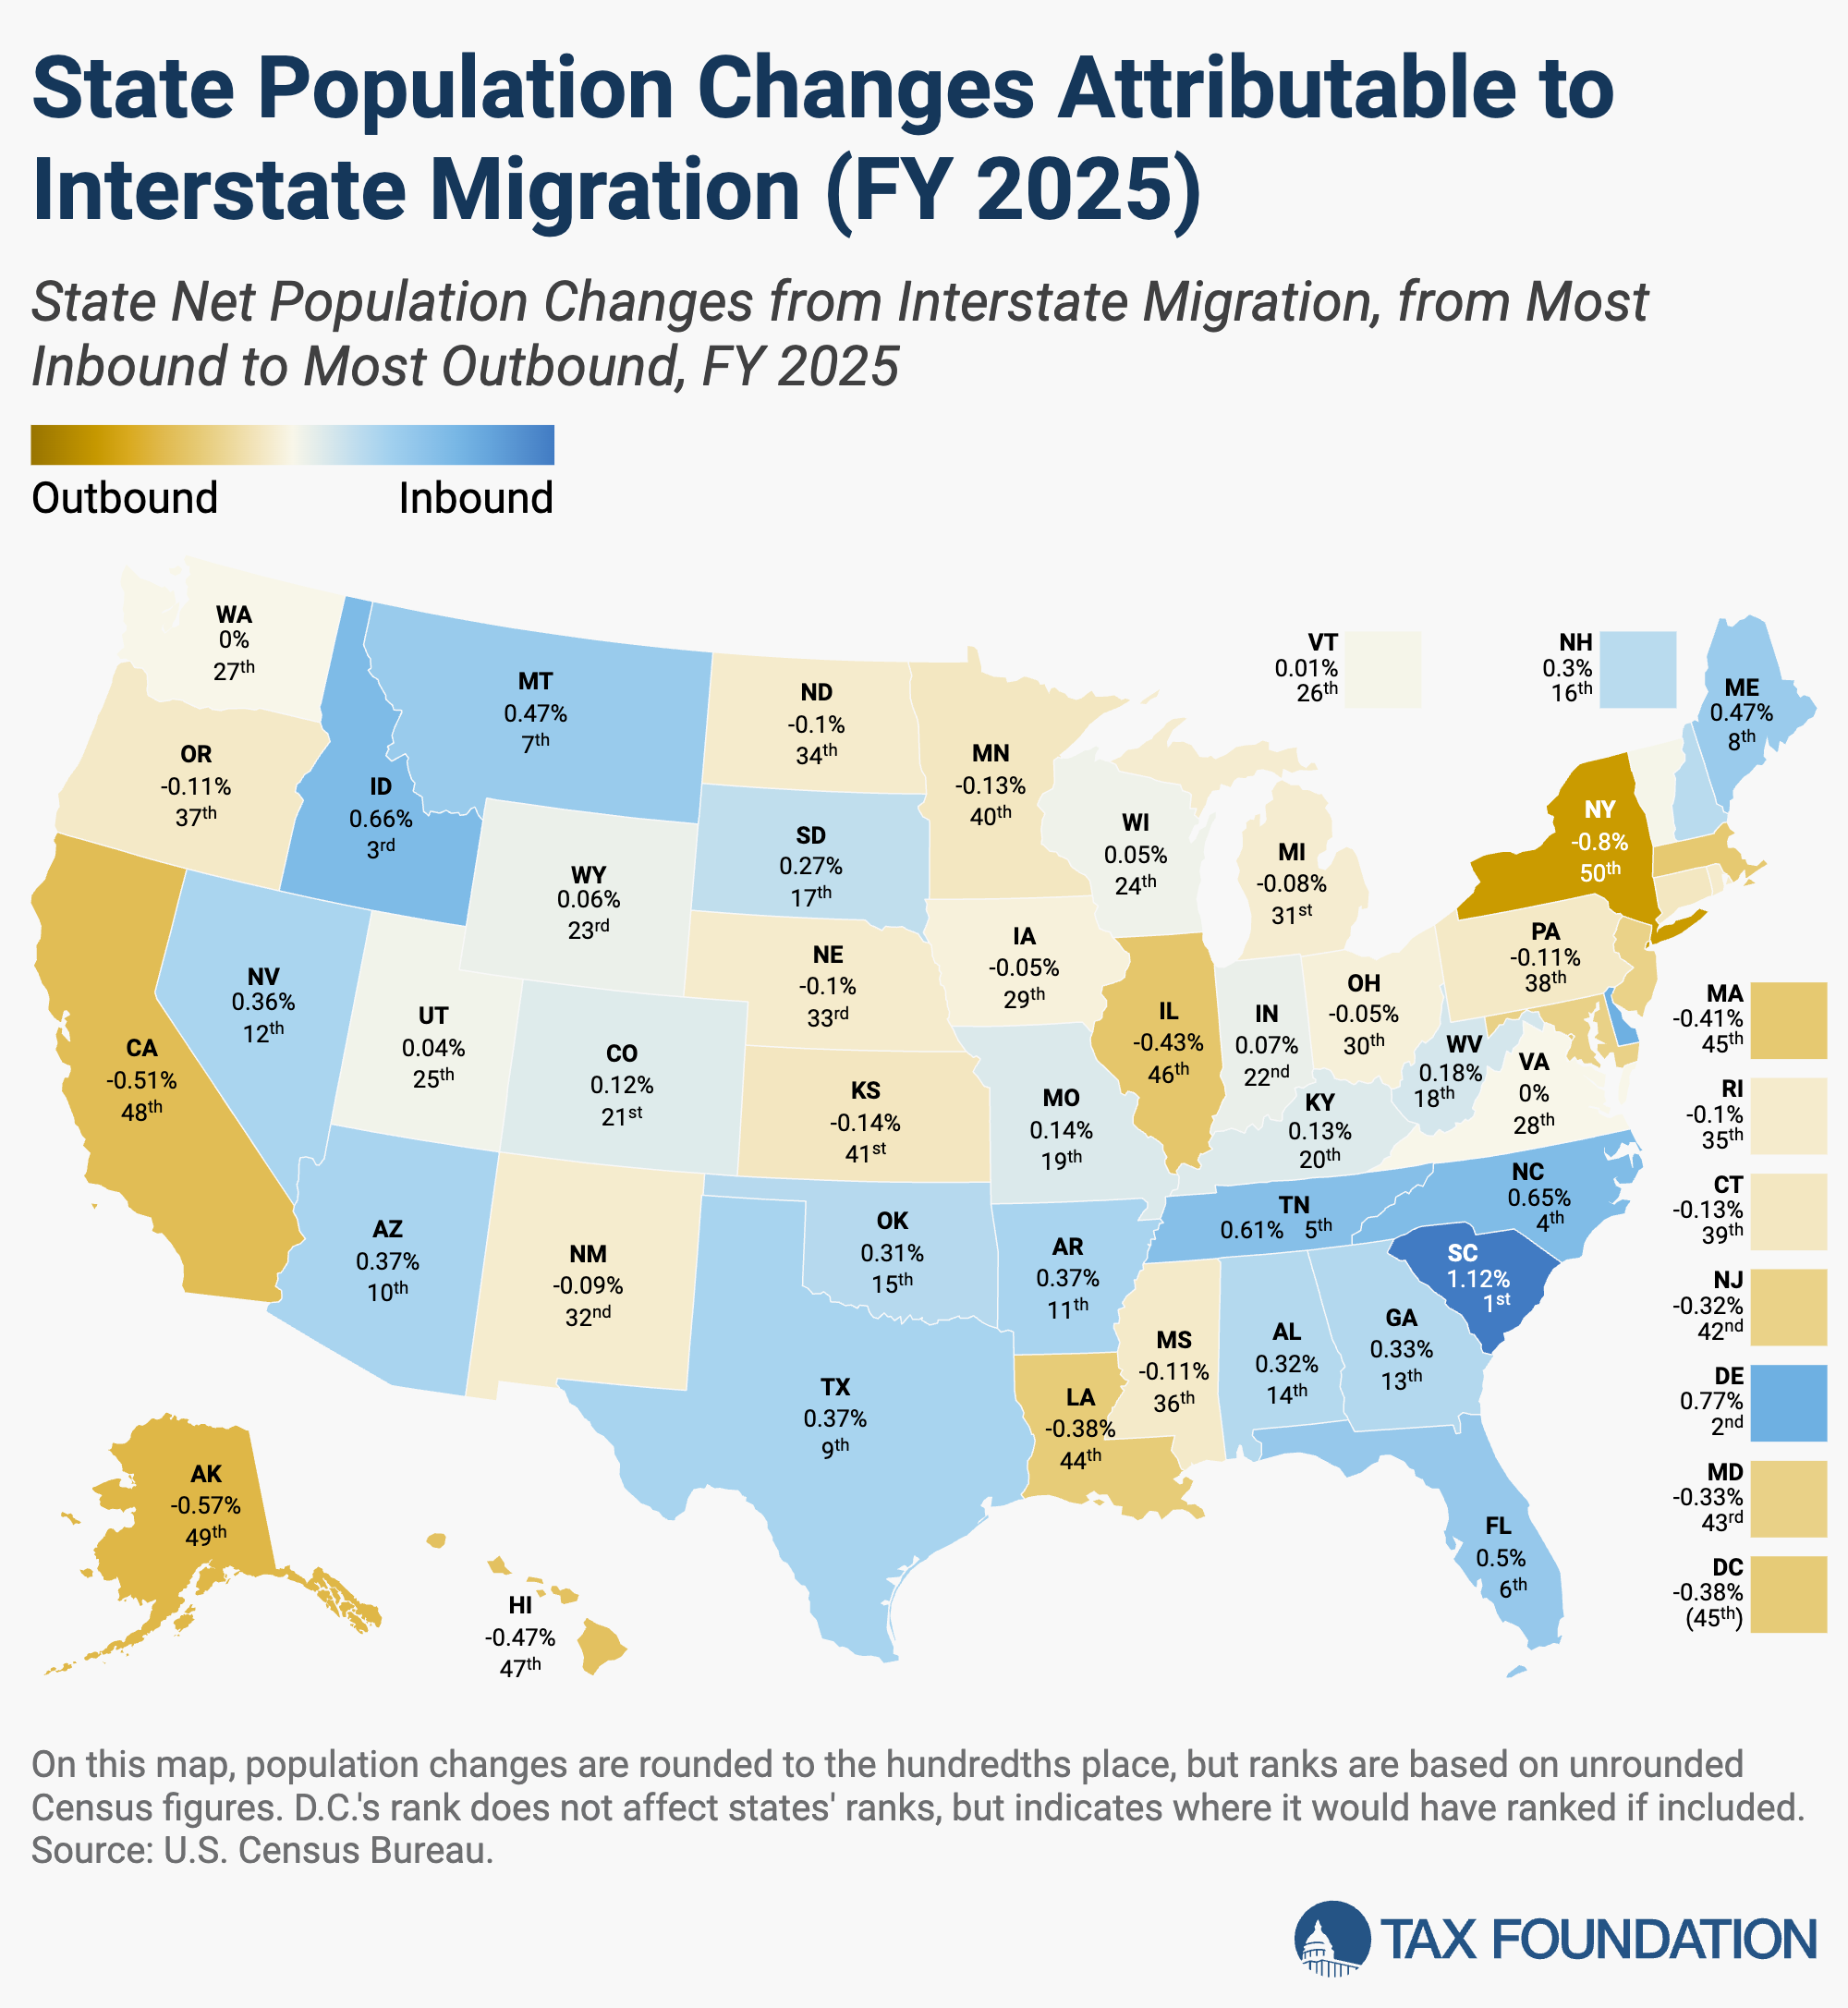
South Carolina saw the largest population growth attributable to domestic interstate migration at 1.12 percent, followed by Delaware (+0.77 percent). At the other end of the spectrum, New York (-0.80 percent) and Alaska (-0.57 percent) lost the greatest share of their populations relative to other states. The correlation between population net gain and AGI net gain is strong, but some states (like Florida, South Carolina, and Idaho) outperform on income.
The map below shows the gains and losses in income tax returns filed, the number of residents on those tax returns, and the AGI attributable to interstate migration for each state.
State Population Changes Attributable to Interstate Migration (FY 2025)
State Net Population Changes from Interstate Migration, from Most Inbound to Most Outbound, FY 2025
Winners and Losers of Interstate Migration: Counties
The county that gained the greatest number of tax filers due to interstate migration between 2022 and 2023 was New York County (Manhattan), which, ironically, lost $922 million in AGI, implying that wealthy taxpayers moved out, and lower-income households moved in. Maricopa County, AZ (+9,353), Harris County, TX (+8,955), King County, WA (+8,297), and Clark County, NV (+7,524), were the other counties that saw the largest inflow of tax filers via interstate migration.
The 10 counties with the largest net losses in tax filers to out-of-state locations were all in either California or New York. These are Los Angeles County, CA (-17,496); Queens County, NY (-17,109); Bronx County, NY (-16,319); Orange County, CA (-11,618); Suffolk County, NY (-10,434); San Diego County, CA (-9,401); Nassau County, NY (-9,130); Riverside County, CA (-8,968); San Bernardino County, CA (-8,462); and Kings County, NY (-6,924).
Two Florida counties gained the most in net AGI: Palm Beach County (+$3 billion) and Collier County (+$2.25 billion). Meanwhile, Cook County, IL (-$4.35 billion), and two California counties, Los Angeles County (-$4.23 billion) and Santa Clara County (-$2.8 billion), lost the most in net AGI. While intrastate moves are always common, as people frequently move between homes within the same state, some of the more populated and urban centers of California, Texas, Florida, and Illinois lost a disproportionate number of people to other counties within the same states.
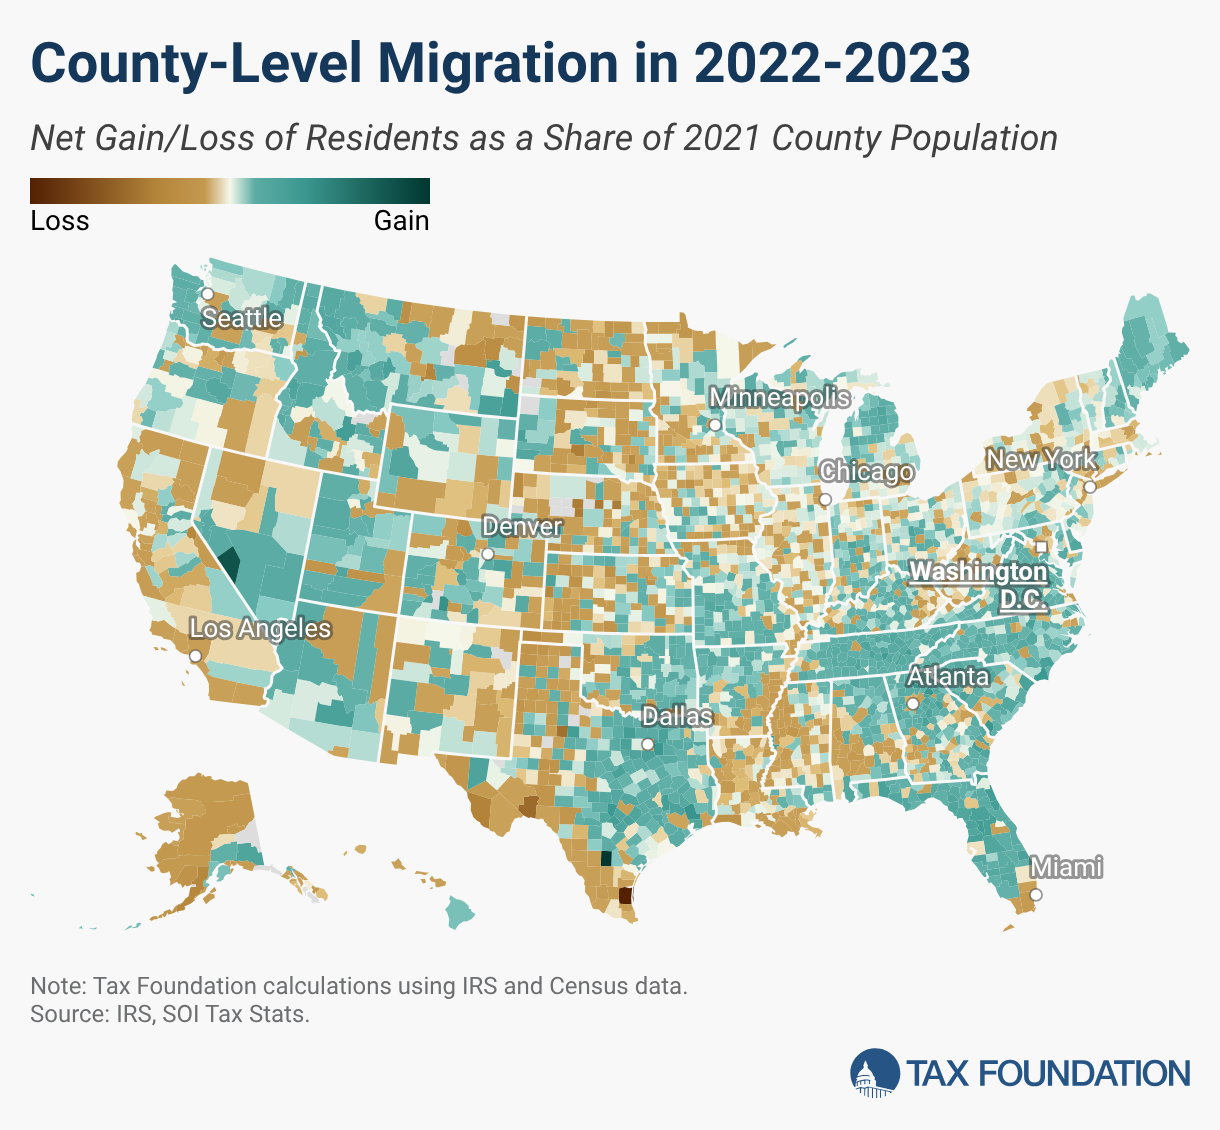
Interestingly, county-level migration patterns were not homogeneous within some states. Many states show very high coefficients of variation (CV) for both same-state and interstate flows. This means migration is not evenly distributed—a few counties experience huge gains or losses while most see little movement. Texas stands out dramatically, with enormous variation in both interstate and intrastate migration (and a standard deviation of 3,828 people per county for intrastate). California, Florida, Colorado, and Georgia also show very high internal dispersion.
Some counties gain interstate but lose intrastate (e.g., Harris County, TX, which was a big interstate winner but a major same-state loser). Other counties win on both fronts (including many fast-growing Sun Belt suburbs). This shows people leave expensive urban cores for nearby suburbs, and people from other states arrive in growing metro areas.
The map below shows county-level migration patterns in 2022-2023 and distinguishes between migration to/from different states and in-state migration.
County-Level Migration in 2022-2023
Net Gain/Loss of Residents as a Share of 2021 County Population
More Americans Moved to States with Lower Taxes and Sound Tax Structures
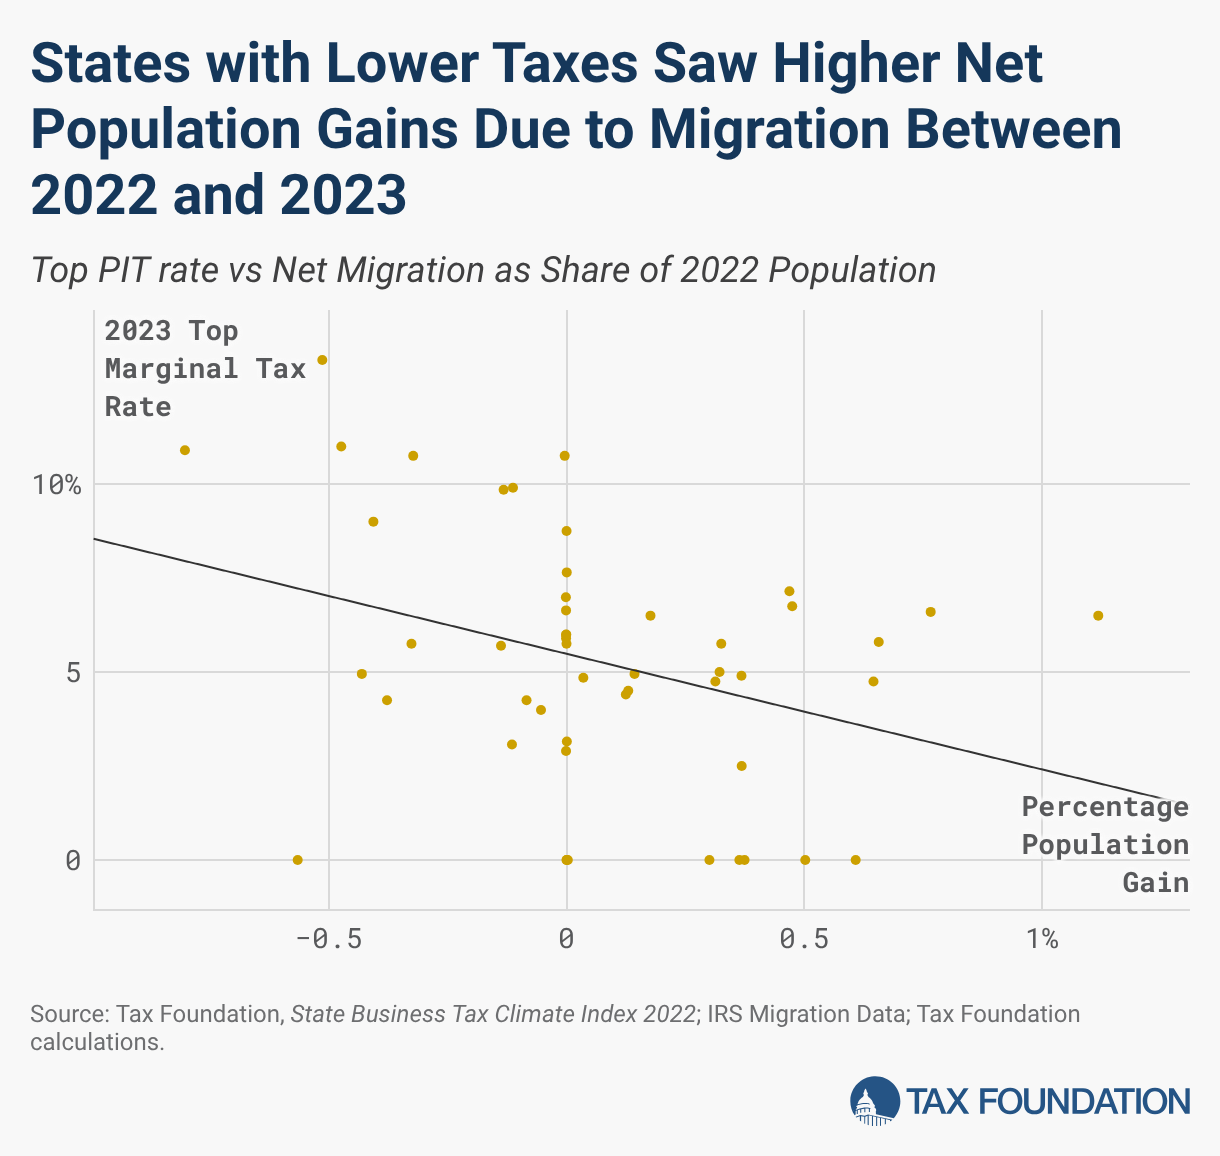
The 2022–2023 data confirm a clear negative relationship between top marginal individual income tax rates and net per capita migration. States with no individual income tax (Florida, Texas, Tennessee, Nevada, and others) consistently rank among the strongest gainers, while states with the highest top rates (California at 13.3 percent, New York at 10.9 percent, and New Jersey at 10.75 percent) dominate the list of largest losers.
A scatter plot of net population gains per capita against the top marginal state income tax rate (as of the latest Tax Foundation analysis) shows a moderate negative correlation (r = -0.33), with an R2 of 0.114, suggesting that taxes explain roughly 11 percent of the migration patterns between states. In other words, variations in state tax competitiveness explain roughly 11 percent of people’s decisions to move between states. Notably, South Carolina achieved the highest per capita inflow despite a moderate 6.0 percent top rate, indicating that broader factors such as climate, cost of living, and economic opportunity also contribute to attractiveness.
States with Lower Taxes Saw Higher Net Population Gains Due to Migration Between 2022 and 2023
Top PIT rate vs Net Migration as Share of 2022 Population
Among the 25 states with the most competitive tax structures (per the Tax Foundation’s State Tax Competitiveness Index), the majority experienced net inbound migration of both population and income. By contrast, states with higher overall tax burdens and less competitive structures overwhelmingly lost residents and taxable income. These patterns have meaningful implications for state budgets: inbound states gain revenue from new filers and economic activity, while outbound states face potential pressure on tax collections and public services.
The 2022–2023 IRS migration data reinforce that tax policy remains an important factor in Americans’ location decisions. States that maintain competitive, low-burden tax systems continue to attract population and income, while those with higher and more complex tax structures experience sustained outflows. Policymakers seeking to bolster long-term economic growth would do well to consider these trends when evaluating tax reform options.
Why Interstate Migration Matters
Interstate migration has significant fiscal and economic consequences for states. When residents move out, states lose not only population but also the tax revenue those individuals generate over time. Conversely, states that attract new residents gain additional taxpayers and economic activity without the need to raise tax rates.
Over the long term, sustained net out-migration can put pressure on state budgets, reduce the tax base, slow economic growth, and make it more difficult to fund public services such as education, infrastructure, and healthcare. This can also create a negative spiral for tax policy in the state, where policymakers are forced to raise tax rates on a shrinking base in order to finance existing services, leading to further exodus from the state. The 2022–2023 data show that these dynamics are not abstract—they are actively reshaping state economies across the country consistently over time. States experiencing sustained inflows are positioned to expand their economies, while those with persistent outflows risk fiscal strain.
Higher-Income Residents Moved to Low-Tax States
A particularly notable feature of the 2022–2023 migration patterns is the movement of higher-income residents. States with no income tax or lower overall tax burdens not only gained population but also attracted a disproportionate share of adjusted gross income. Florida led with a net AGI gain equivalent to roughly $184,771 per new resident. Texas, South Carolina, North Carolina, and Tennessee also recorded strong income inflows, with net AGI per new resident typically ranging from $49,000 to $70,000.
In contrast, high-tax states suffered substantial AGI losses per departing resident. California lost approximately $59,440 in AGI per person, New York lost $62,633, New Jersey lost $85,562, Illinois lost $110,618, and Massachusetts lost $141,672. This selective out-migration of higher earners significantly amplifies the fiscal impact: losing states forfeit far more revenue per person than the average resident, while gaining states receive a much stronger boost to their tax base. These trends suggest that tax competitiveness remains a critical factor for retaining and attracting high-income households, who contribute disproportionately to state tax revenues.
A Note on the Data
When analyzing interstate migration and its implications for state economies and tax policy, the IRS Statistics of Income migration data remains one of the most relevant and widely used sources. Unlike the US Census Bureau’s American Community Survey, which offers richer demographic details such as age, race, and education but relies on self-reported income, the IRS data tracks actual adjusted gross income and tax returns moving between states with high precision. This makes it particularly valuable for understanding the economic selectivity of migration—specifically, how high earners and taxable income are shifting across state lines.
While moving company data from U-Haul and United Van Lines also provide timely snapshots, they tend to reflect narrower segments of the population. Overall, for assessing the fiscal impact of migration on state budgets and competitiveness, IRS data continues to offer unmatched insight, even as it underrepresents non-filers and is released later than Census and industry data. A highly comprehensive analysis combine IRS figures with Census data to capture both the economic magnitude and the broader demographic picture.
New Arrival: “The COVID Code” by Zowe Smith
The Art of Liberty Foundation is proud to help promote and distribute a story they didn’t want told: The COVID Code: My Life in the Thrill Kill Medical Cult by Zowe Smith. More than a personal journey, this book documents the dark influence of Big Pharma over Western medicine. Zowe Smith, a former healthcare employee, shares a shocking insider’s account of the systemic fraud she witnessed behind hospital doors.
She uncovers how the current system is capable of murdering patients for profit while hiding its crimes by lying with statistics—specifically through the ICD coding system. Readers looking for truth, resistance, and redemption will find all three in these pages. Once you start reading, you won’t look at the medical establishment or public health the same way again.
Get Your Copy Today:
- Paperback Edition: Purchase The COVID Code now for $25.00 exclusively at ArtOfLiberty.org/Store.

Support the Art of Liberty Foundation’s Mission:
Go paid at the $5 a month level, and we will send you both the PDF and e-Pub versions of Etienne’s new book: To See the Cage Is to Leave It - 25 Techniques the Few Use to Control the Many, the PDF of Hayek for the 21st Century and a coupon code for 10% off anything in the https://artofliberty.org/store/.
Go paid at the $50 a year level, and we will send you a free paperback edition of The Covid Code – My Life in the Thrill Kill Medical Cult by Zowe Smith OR Etienne’s new book: To See the Cage Is to Leave It OR “Government” - The Biggest Scam in History… Exposed! OR a 64GB Liberator flash drive PLUS a paperback copy of Hayek for the 21st Century if you live in the US.
Support us at the $250 Founding Member Level and get a free paperback edition of The Covid Code – My Life in the Thrill Kill Medical Cult by Zowe Smith AND a signed high-resolution hardcover of “Government” - The Biggest Scam in History... Exposed! + Liberator flash drive AND a signed high-resolution hardcover of Etienne’s new book: To See the Cage Is to Leave It PLUS everything else in our “Everything Bundle” PLUS a paperback copy of Hayek for the 21st Century delivered domestically.

Comments ()